RSI K-Means Clustering [UAlgo]The "RSI K-Means Clustering " indicator is a technical analysis tool that combines the Relative Strength Index (RSI) with K-means clustering techniques. This approach aims to provide more nuanced insights into market conditions by categorizing RSI values into overbought, neutral, and oversold clusters.
The indicator adjusts these clusters dynamically based on historical RSI data, allowing for more adaptive and responsive thresholds compared to traditional fixed levels. By leveraging K-means clustering, the indicator identifies patterns in RSI behavior, which can help traders make more informed decisions regarding market trends and potential reversals.
🔶 Key Features
K-means Clustering: The indicator employs K-means clustering, an unsupervised machine learning technique, to dynamically determine overbought, neutral, and oversold levels based on historical RSI data.
User-Defined Inputs: You can customize various aspects of the indicator's behavior, including:
RSI Source: Select the data source used for RSI calculation (e.g., closing price).
RSI Length: Define the period length for RSI calculation.
Training Data Size: Specify the number of historical RSI values used for K-means clustering.
Number of K-means Iterations: Set the number of iterations performed by the K-means algorithm to refine cluster centers.
Overbought/Neutral/Oversold Levels: You can define initial values for these levels, which will be further optimized through K-means clustering.
Alerts: The indicator can generate alerts for various events, including:
Trend Crossovers: Alerts for when the RSI crosses above/below the neutral zone, signaling potential trend changes.
Overbought/Oversold: Alerts when the RSI reaches the dynamically determined overbought or oversold thresholds.
Reversals: Alerts for potential trend reversals based on RSI crossing above/below the calculated overbought/oversold levels.
RSI Classification: Alerts based on the current RSI classification (ranging, uptrend, downtrend).
🔶 Interpreting Indicator
Adjusted RSI Value: The primary plot represents the adjusted RSI value, calculated based on the relative position of the current RSI compared to dynamically adjusted overbought and oversold levels. This value provides an intuitive measure of the market's momentum. The final overbought, neutral, and oversold levels are determined by K-means clustering and are displayed as horizontal lines. These levels serve as dynamic support and resistance points, indicating potential reversal zones.
Classification Symbols : The "RSI K-Means Clustering " indicator uses specific symbols to classify the current market condition based on the position of the RSI value relative to dynamically determined clusters. These symbols provide a quick visual reference to help traders understand the prevailing market sentiment. Here's a detailed explanation of each classification symbol:
Ranging Classification ("R")
This symbol appears when the RSI value is closest to the neutral threshold compared to the overbought or oversold thresholds. It indicates a ranging market, where the price is moving sideways without a clear trend direction. In this state, neither buyers nor sellers are in control, suggesting a period of consolidation or indecision. This is often seen as a time to wait for a breakout or reversal signal before taking a position.
Up-Trend Classification ("↑")
The up-trend symbol, represented by an upward arrow, is displayed when the RSI value is closer to the overbought threshold than to the neutral or oversold thresholds. This classification suggests that the market is in a bullish phase, with buying pressure outweighing selling pressure. Traders may consider this as a signal to enter or hold long positions, as the price is likely to continue rising until the market reaches an overbought condition.
Down-Trend Classification ("↓")
The down-trend symbol, depicted by a downward arrow, appears when the RSI value is nearest to the oversold threshold. This indicates a bearish market condition, where selling pressure dominates. The market is likely experiencing a downward movement, and traders might view this as an opportunity to enter or hold short positions. This symbol serves as a warning of potential further declines, especially if the RSI continues to move toward the oversold level.
Bullish Reversal ("▲")
This signal occurs when the RSI value crosses above the oversold threshold. It indicates a potential shift from a downtrend to an uptrend, suggesting that the market may start to move higher. Traders might use this signal as an opportunity to enter long positions.
Bearish Reversal ("▼")
This signal appears when the RSI value crosses below the overbought threshold. It suggests a possible transition from an uptrend to a downtrend, indicating that the market may begin to decline. This signal can alert traders to consider entering short positions or taking profits on long positions.
These classification symbols are plotted near the adjusted RSI line, with their positions adjusted based on the standard deviation and a distance multiplier. This placement helps in visualizing the classification's strength and ensuring clarity in the indicator's presentation. By monitoring these symbols, traders can quickly assess the market's state and make more informed trading decisions.
🔶 Disclaimer
Use with Caution: This indicator is provided for educational and informational purposes only and should not be considered as financial advice. Users should exercise caution and perform their own analysis before making trading decisions based on the indicator's signals.
Not Financial Advice: The information provided by this indicator does not constitute financial advice, and the creator (UAlgo) shall not be held responsible for any trading losses incurred as a result of using this indicator.
Backtesting Recommended: Traders are encouraged to backtest the indicator thoroughly on historical data before using it in live trading to assess its performance and suitability for their trading strategies.
Risk Management: Trading involves inherent risks, and users should implement proper risk management strategies, including but not limited to stop-loss orders and position sizing, to mitigate potential losses.
No Guarantees: The accuracy and reliability of the indicator's signals cannot be guaranteed, as they are based on historical price data and past performance may not be indicative of future results.
Tìm kiếm tập lệnh với "stop loss"

Volumetric Volatility Blocks [UAlgo]The Volumetric Volatility Blocks indicator is designed to identify significant volatility blocks based on price and volume data. It utilizes a combination of the Average True Range (ATR) and Simple Moving Average (SMA) to determine the volatility level and identify periods of heightened market activity. The indicator highlights these volatility blocks, providing traders with visual cues for potential trading opportunities. It differentiates between bullish and bearish volatility by analyzing price movement and volume, offering a nuanced view of market sentiment. This tool is particularly useful for traders looking to capitalize on periods of high volatility and momentum shifts.
🔶 Key Features
Volatility Measurement Length: Controls the period used to calculate the ATR.
Smooth Length of Volatility: Defines the period for the SMA used to smooth the ATR.
Multiplier of SMA: Sets the minimum threshold for the ATR to be considered a "high volatility" block.
Show Last X Volatility Blocks: Determines how many of the most recent volatility blocks are displayed on the chart.
Mitigation Method: Choose between "Close" or "Wick" price to filter volatility blocks based on price action. This helps avoid highlighting blocks broken by the chosen price level.
Volume Info: Displaying the volume associated with each block.
Up/Down Block Color: Sets the color for bullish and bearish volatility blocks.
🔶 Usage
The Volumetric Volatility Blocks indicator visually represents periods of high volatility with blocks on the chart. Green blocks indicate bullish volatility, while red blocks indicate bearish volatility.
Bullish Volatility Blocks: When the ATR surpasses the smoothed ATR multiplied by the set multiplier, and the price closes higher than it opened, a bullish block is formed. These blocks are generally used to identify potential buying opportunities as they indicate upward momentum.
Bearish Volatility Blocks: Conversely, bearish blocks form under the same conditions, but when the price closes lower than it opened. These blocks can signal potential selling opportunities as they highlight downward momentum.
Volume Information: Each block can display volume data, providing insight into the strength of the market movement. The percentage shown on the block indicates the relative volume contribution of that block, helping traders assess the significance of the volatility.
The volume percentages in the Volumetric Volatility Blocks indicator are calculated based on the total volume of the most recent volatility blocks. For each of the most recent volatility blocks, the percentage of the total volume is calculated by dividing the block's volume by the total volume:
🔶 Disclaimer
Use with Caution: This indicator is provided for educational and informational purposes only and should not be considered as financial advice. Users should exercise caution and perform their own analysis before making trading decisions based on the indicator's signals.
Not Financial Advice: The information provided by this indicator does not constitute financial advice, and the creator (UAlgo) shall not be held responsible for any trading losses incurred as a result of using this indicator.
Backtesting Recommended: Traders are encouraged to backtest the indicator thoroughly on historical data before using it in live trading to assess its performance and suitability for their trading strategies.
Risk Management: Trading involves inherent risks, and users should implement proper risk management strategies, including but not limited to stop-loss orders and position sizing, to mitigate potential losses.
No Guarantees: The accuracy and reliability of the indicator's signals cannot be guaranteed, as they are based on historical price data and past performance may not be indicative of future results.

Money Flow Index Trend Zone Strength [UAlgo]The "Money Flow Index Trend Zone Strength " indicator is designed to analyze and visualize the strength of market trends and OB/OS zones using the Money Flow Index (MFI). The MFI is a momentum indicator that incorporates both price and volume data, providing insights into the buying and selling pressure in the market. This script enhances the traditional MFI by introducing trend and zone strength analysis, helping traders identify potential trend reversals and continuation points.
🔶 Customizable Settings
Amplitude: Defines the range for the MFI Zone Strength calculation.
Wavelength: Period used for the MFI calculation and Stochastic calculations.
Smoothing Factor: Smoothing period for the Stochastic calculations.
Show Zone Strength: Enables/disables visualization of the MFI Zone Strength line.
Show Trend Strength: Enables/disables visualization of the MFI Trend Strength area.
Trend Strength Signal Length: Period used for the final smoothing of the Trend Strength indicator.
Trend Anchor: Selects the anchor point (0 or 50) for the Trend Strength Stochastic calculation.
Trend Transform MA Length: Moving Average length for the Trend Transform calculation.
🔶 Calculations
Zone Strength (Stochastic MFI):
The highest and lowest MFI values over a specified amplitude are used to normalize the MFI value:
MFI Highest: Highest MFI value over the amplitude period.
MFI Lowest: Lowest MFI value over the amplitude period.
MFI Zone Strength: (MFI Value - MFI Lowest) / (MFI Highest - MFI Lowest)
By normalizing and smoothing the MFI values, we aim to highlight the relative strength of different market zones.
Trend Strength:
The smoothed MFI zone strength values are further processed to calculate the trend strength:
EMA of MFI Zone Strength: Exponential Moving Average of the MFI Zone Strength over the wavelength period.
Stochastic of EMA: Stochastic calculation of the EMA values, smoothed with the same smoothing factor.
Purpose: The trend strength calculation provides insights into the underlying market trends. By using EMA and stochastic functions, we can filter out noise and better understand the overall market direction. This helps traders stay aligned with the prevailing trend and make more informed trading decisions.
🔶 Usage
Interpreting Zone Strength: The zone strength plot helps identify overbought and oversold conditions. A higher zone strength indicates potential overbought conditions, while a lower zone strength suggests oversold conditions, can suggest areas for entry/exit decisions.
Interpreting Trend Strength: The trend strength plot visualizes the underlying market trend, can help signal potential trend continuation or reversal based on the chosen anchor point.
Using the Trend Transform: The trend transform plot provides an additional layer of trend analysis, helping traders identify potential trend reversals and continuation points.
Combine the insights from the zone strength and trend strength plots with other technical analysis tools to make informed trading decisions. Look for confluence between different indicators to increase the reliability of your trades.
🔶 Disclaimer:
Use with Caution: This indicator is provided for educational and informational purposes only and should not be considered as financial advice. Users should exercise caution and perform their own analysis before making trading decisions based on the indicator's signals.
Not Financial Advice: The information provided by this indicator does not constitute financial advice, and the creator (UAlgo) shall not be held responsible for any trading losses incurred as a result of using this indicator.
Backtesting Recommended: Traders are encouraged to backtest the indicator thoroughly on historical data before using it in live trading to assess its performance and suitability for their trading strategies.
Risk Management: Trading involves inherent risks, and users should implement proper risk management strategies, including but not limited to stop-loss orders and position sizing, to mitigate potential losses.
No Guarantees: The accuracy and reliability of the indicator's signals cannot be guaranteed, as they are based on historical price data and past performance may not be indicative of future results.

Momentum & Squeeze Oscillator [UAlgo]The Momentum & Squeeze Oscillator is a technical analysis tool designed to help traders identify shifts in market momentum and potential squeeze conditions. This oscillator combines multiple timeframes and periods to provide a detailed view of market dynamics. It enhances the decision-making process for both short-term and long-term traders by visualizing momentum with customizable colors and alerts.
🔶 Key Features
Custom Timeframe Selection: Allows users to select a custom timeframe for oscillator calculations, providing flexibility in analyzing different market periods.
Recalculation Option: Enables or disables the recalculation of the indicator, offering more control over real-time data processing.
Squeeze Background Visualization: Highlights potential squeeze conditions with a background color, helping traders quickly spot consolidation periods.
Adjustable Squeeze Sensitivity: Users can modify the sensitivity of the squeeze detection, tailoring the indicator to their specific trading style and market conditions.
Bar Coloring Condition: Option to color the price bars based on momentum conditions, enhancing the visual representation of market trends.
Threshold Bands: Option to fill threshold bands for a clearer visualization of overbought and oversold levels.
Reference Lines: Display reference lines for overbought, oversold, and mid-levels, aiding in quick assessment of momentum extremes.
Multiple Output Modes: Offers different output visualization modes, including:
ALL: Displays all calculated momentum values (fast, medium, slow).
AVG: Shows the average momentum, providing a consolidated view.
STD: Displays the standard deviation of momentum, useful for understanding volatility.
Alerts: Configurable alerts for key momentum events such as crossovers and squeeze conditions, keeping traders informed of important market changes.
🔶 Usage
The Momentum & Squeeze Oscillator can be used for various trading purposes:
Trend Identification: Use the oscillator to determine the direction and strength of market trends. By analyzing the average, fast, medium, and slow momentum lines, traders can gain insights into short-term and long-term market movements.
Squeeze Detection: The indicator highlights periods of low volatility (squeeze conditions) which often precede significant price movements. Traders can use this information to anticipate and prepare for potential breakouts.
Overbought/Oversold Conditions: The oscillator helps identify overbought and oversold conditions, indicating potential reversal points. This is particularly useful for timing entry and exit points in the market.
Momentum Shifts: By monitoring the crossover of momentum lines with key levels (e.g., the 50 level), traders can spot shifts in market momentum, allowing them to adjust their positions accordingly.
🔶 Disclaimer:
Use with Caution: This indicator is provided for educational and informational purposes only and should not be considered as financial advice. Users should exercise caution and perform their own analysis before making trading decisions based on the indicator's signals.
Not Financial Advice: The information provided by this indicator does not constitute financial advice, and the creator (UAlgo) shall not be held responsible for any trading losses incurred as a result of using this indicator.
Backtesting Recommended: Traders are encouraged to backtest the indicator thoroughly on historical data before using it in live trading to assess its performance and suitability for their trading strategies.
Risk Management: Trading involves inherent risks, and users should implement proper risk management strategies, including but not limited to stop-loss orders and position sizing, to mitigate potential losses.
No Guarantees: The accuracy and reliability of the indicator's signals cannot be guaranteed, as they are based on historical price data and past performance may not be indicative of future results.

Strategy SEMA SDI WebhookPurpose of the Code:
The strategy utilizes Exponential Moving Averages (EMA) and Smoothed Directional Indicators (SDI) to generate buy and sell signals. It includes features like leverage, take profit, stop loss, and trailing stops. The strategy is intended for backtesting and automating trades based on the specified indicators and conditions.
Key Components and Functionalities:
1.Strategy Settings:
Overlay: The strategy will overlay on the price chart.
Slippage: Set to 1.
Commission Value: Set to 0.035.
Default Quantity Type: Percent of equity.
Default Quantity Value: 50% of equity.
Initial Capital: Set to 1000 units.
Calculation on Order Fills: Enabled.
Process Orders on Close: Enabled.
2.Date and Time Filters:
Inputs for enabling/disabling start and end dates.
Filters to execute strategy only within specified date range.
3.Leverage and Quantity:
Leverage: Adjustable leverage input (default 3).
USD Percentage: Adjustable percentage of equity to use for trades (default 50%).
Initial Capital: Calculated based on leverage and percentage of equity.
4.Take Profit, Stop Loss, and Trailing Stop:
Inputs for enabling/disabling take profit, stop loss, and trailing stop.
Adjustable parameters for take profit percentage (default 25%), stop loss percentage (default 4.8%), and trailing stop percentage (default 1.9%).
Calculations for take profit, stop loss, trailing price, and maximum profit tracking.
5.EMA Calculations:
Fast and slow EMAs.
Smoothed versions of the fast and slow EMAs.
6.SDI Calculations:
Directional movement calculation for positive and negative directional indicators.
Difference between the positive and negative directional indicators, smoothed.
7.Buy/Sell Conditions:
Long (Buy) Condition: Positive DI is greater than negative DI, and fast EMA is greater than slow EMA.
Short (Sell) Condition: Negative DI is greater than positive DI, and fast EMA is less than slow EMA.
8.Strategy Execution:
If buy conditions are met, close any short positions and enter a long position.
If sell conditions are met, close any long positions and enter a short position.
Exit conditions for long and short positions based on take profit, stop loss, and trailing stop levels.
Close all positions if outside the specified date range.
Usage:
This strategy is used to automate trading based on the specified conditions involving EMAs and SDI. It allows backtesting to evaluate performance based on historical data. The strategy includes risk management through take profit, stop loss, and trailing stops to protect gains and limit losses. Traders can customize the parameters to fit their specific trading preferences and risk tolerance. Differently, it can perform leverage analysis and use it as a template.
By using this strategy, traders can systematically execute trades based on technical indicators, helping to remove emotional bias and improve consistency in trading decisions.
Important Note:
This script is provided for educational and template purposes and does not constitute financial advice. Traders and investors should conduct their research and analysis before making any trading decisions.

Fair Value Gap (FVG) Oscillator [UAlgo]The "Fair Value Gap (FVG) Oscillator " is designed to identify and visualize Fair Value Gaps (FVG) within a given lookback period on a trading chart. This indicator helps traders by highlighting areas where price gaps may signify potential trading opportunities, specifically bullish and bearish patterns. By leveraging volume and Average True Range (ATR) data, the FVG Oscillator aims to enhance the accuracy of pattern recognition and provide more reliable signals for trading decisions.
🔶 Identification of Fair Value Gap (FVG)
Fair Value Gaps (FVG) are specific price areas where gaps occur, and they are often considered significant in technical analysis. These gaps can indicate potential future price movements as the market may return to fill these gaps. This indicator identifies two types of FVGs:
Bullish FVG: Occurs when the current low price is higher than the high price two periods ago. This condition suggests a potential upward price movement.
Obtains with:
low > high
Bearish FVG: Occurs when the current high price is lower than the low price two periods ago. This condition suggests a potential downward price movement.
Obtains with:
high < low
The FVG Oscillator not only identifies these gaps but also verifies them using volume and ATR conditions to ensure more reliable trading signals.
🔶 Key Features
Lookback Period: Users can set the lookback period to determine how far back the indicator should search for FVG patterns.
ATR Multiplier: The ATR Multiplier is used to adjust the sensitivity of the ATR-based conditions for verifying FVG patterns.
Volume SMA Period: This setting determines the period for the Simple Moving Average (SMA) of the volume, which helps in identifying high volume conditions.
Why ATR and Volume are Used?
ATR (Average True Range) and volume are integrated into the Fair Value Gap (FVG) Oscillator to enhance the accuracy and reliability of the identified patterns. ATR measures market volatility, helping to filter out insignificant price gaps and focus on impactful ones, ensuring that the signals are relevant and strong. Volume, on the other hand, confirms the strength of price movements. High volume often indicates the sustainability of these movements, reducing the likelihood of false signals. Together, ATR and volume ensure that the detected FVGs are both significant and supported by market activity, providing more trustworthy trading signals.
Normalized Values: The FVG counts are normalized to enhance the visual representation and interpretation of the patterns on the chart.
Visual Customization and Plotting: Users can customize the colors for positive (bullish) and negative (bearish) areas, and choose whether to display these areas on the chart, also plots the bullish and bearish FVG counts, a zero line, and the net value of FVG counts. Additionally, it uses histograms to display the width of verified bullish and bearish patterns.
🔶 Disclaimer:
Use with Caution: This indicator is provided for educational and informational purposes only and should not be considered as financial advice. Users should exercise caution and perform their own analysis before making trading decisions based on the indicator's signals.
Not Financial Advice: The information provided by this indicator does not constitute financial advice, and the creator (UAlgo) shall not be held responsible for any trading losses incurred as a result of using this indicator.
Backtesting Recommended: Traders are encouraged to backtest the indicator thoroughly on historical data before using it in live trading to assess its performance and suitability for their trading strategies.
Risk Management: Trading involves inherent risks, and users should implement proper risk management strategies, including but not limited to stop-loss orders and position sizing, to mitigate potential losses.
No Guarantees: The accuracy and reliability of the indicator's signals cannot be guaranteed, as they are based on historical price data and past performance may not be indicative of future results.

[INVX] Trailing StopDescription:
The Adjustable Trailing Stop Indicator is a practical tool designed to enhance your trading strategy by allowing for automatic modifications of stop-loss orders according to your specified parameters. This indicator provides a dynamic alternative to the traditional static stop-loss orders, assisting in managing your potential profits and curbing possible losses.
Features and Functionality:
The Trailing Stop Indicator provides three main inputs for customization:
"Trailing Stop Start Date" : This input enables you to set the start date for the trailing stop. From this date forward, the indicator begins tracking price changes and adjusts the stop-loss order in response.
"Trigger Delta (%)" : This represents the percentage for the trailing stop. It denotes the set percentage at which the stop order adjusts.
"Order" : This input determines whether the trailing stop applies to a Buy or Sell order. Depending on the selection, the indicator adjusts the stop price as the price escalates (for Sell order) or declines (for Buy order).
How Does the Trailing Stop Indicator Work?
The Trailing Stop Indicator functions by dynamically adjusting the stop price in line with market fluctuations. If the market price rises (for Sell order), the stop price automatically ascends, securing potential profits. In a declining market (for Buy order), the stop price descends according to the market.
This indicator eliminates the need for constant manual adjustments, reducing the impact of emotional trading and helping traders maintain their risk management strategy. By using this tool, traders can implement a more disciplined and systematic approach to trading.

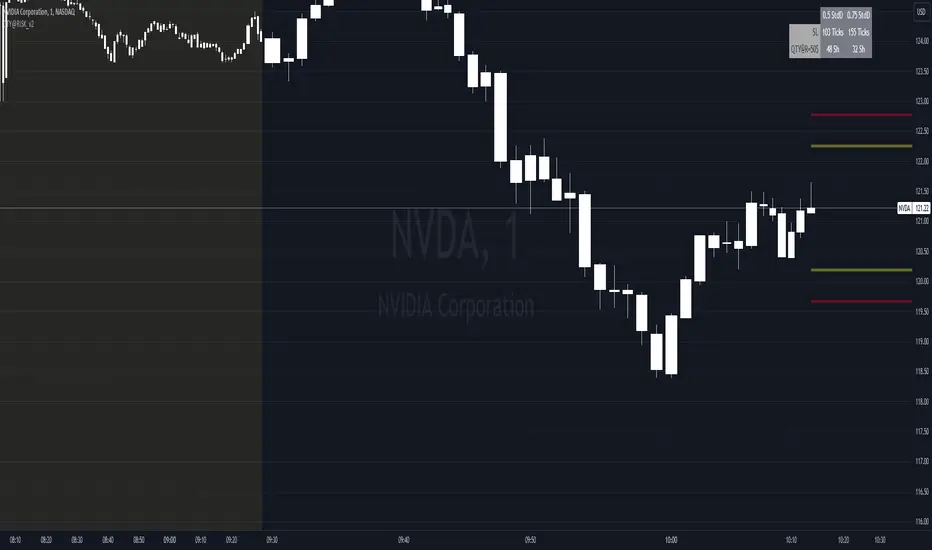
QTY@RISK VWAP based calculationVWAP Volatility-Based Risk Management Calculator for Intraday Trading
Overview
This script is an innovative tool designed to help traders manage risk effectively by calculating position sizes and stop-loss levels using the Volume Weighted Average Price (VWAP) and its standard deviation (StdDev). Unlike traditional methods that rely on time-based calculations, this approach is time-independent within the intraday timeframe, making it particularly useful for traders seeking precision and efficiency.
Key Concepts
VWAP (Volume Weighted Average Price): VWAP is a trading benchmark that represents the average price a security has traded at throughout the day, based on both volume and price. It provides insight into the average price level over a specific period, helping traders understand the market trend.
StdDev (Standard Deviation): In the context of VWAP, the standard deviation measures the volatility around the VWAP. It provides a quantifiable range that traders can use to set stop-loss levels, ensuring they are neither too tight nor too loose.
How the Script Works
1. VWAP Calculation: The script calculates the VWAP continuously as the market trades, integrating both price and volume data.
2. Volatility Measurement: It then computes the standard deviation of the VWAP, giving a measure of market volatility.
3. Stop-Loss Calculation: Using user-defined StdDev factors, the script calculates two stop-loss levels. These levels adjust dynamically based on market conditions, ensuring they remain relevant throughout the trading session.
4. Position Sizing: By incorporating your risk tolerance, the script determines the appropriate position size. This ensures that your maximum loss per trade does not exceed your predefined risk value.
How to Use the Calculator
1. Select Two VWAP StdDev Factors: Choose two standard deviation factors for calculating stop-loss levels. For example, you might choose 0.5 and 0.75 to set conservative and aggressive stop-losses respectively.
2. Set Your Trading Account Size: Enter your total trading capital. For example, $50,000.
3. Maximum Lot Size: Define the maximum number of shares you are willing to trade in a single position. For instance, 200 shares.
4. Risk Value per Trade: Input the maximum amount of money you are willing to risk on a single trade. For instance, $50.
5. Plotting Options: If you wish to visualize the stop-loss levels, enable the plot option and choose the price base for the plot, such as the closing price or the average of the high and low prices (hl2).
Example of Use
1. Initial Setup: After the market opens, wait for at least 15 minutes to ensure the VWAP has stabilized with sufficient volume data.
2. Parameter Configuration: Input your desired parameters into the calculator. For instance:
- VWAP StdDev Factors: 0.5 and 0.75
- Trading Account Size: $50,000
- Maximum Lot Size: 200 shares
- Risk Value per Trade: $50
- Plot Option: On, using "hl2" or "close" as the price base
3. Execution: Based on the inputs, the script calculates the position size and stop-loss levels. If the calculated stop-loss falls within the selected VWAP StdDev range, it will provide you with precise stop-loss prices.
4. Trading: Use the calculated position size and stop-loss levels to execute your trades confidently, knowing that your risk is managed effectively.
Advantages for Traders
- Time Independence: By relying on VWAP and its StdDev, the calculations are not dependent on specific time intervals, making them more adaptable to real-time trading conditions.
- Focus on Strategy: Novice traders can focus more on their trading strategies rather than getting bogged down with complex calculations.
- Dynamic Adjustments: The script adjusts stop-loss levels dynamically based on evolving market conditions, providing more accurate and relevant risk management.
- Flexibility: Traders can tailor the calculator to their risk preferences and trading style by adjusting the StdDev factors and risk parameters.
By incorporating these concepts and using this risk management calculator, traders can enhance their trading efficiency, improve their risk management, and ultimately make more informed trading decisions.
Chande Kroll Trend Strategy (SPX, 1H) | PINEINDICATORSThe "Chande Kroll Stop Strategy" is designed to optimize trading on the SPX using a 1-hour timeframe. This strategy effectively combines the Chande Kroll Stop indicator with a Simple Moving Average (SMA) to create a robust method for identifying long entry and exit points. This detailed description will explain the components, rationale, and usage to ensure compliance with TradingView's guidelines and help traders understand the strategy's utility and application.
Objective
The primary goal of this strategy is to identify potential long trading opportunities in the SPX by leveraging volatility-adjusted stop levels and trend-following principles. It aims to capture upward price movements while managing risk through dynamically calculated stops.
Chande Kroll Stop Parameters:
Calculation Mode: Offers "Linear" and "Exponential" options for position size calculation. The default mode is "Exponential."
Risk Multiplier: An adjustable multiplier for risk management and position sizing, defaulting to 5.
ATR Period: Defines the period for calculating the Average True Range (ATR), with a default of 10.
ATR Multiplier: A multiplier applied to the ATR to set stop levels, defaulting to 3.
Stop Length: Period used to determine the highest high and lowest low for stop calculation, defaulting to 21.
SMA Length: Period for the Simple Moving Average, defaulting to 21.
Calculation Details:
ATR Calculation: ATR is calculated over the specified period to measure market volatility.
Chande Kroll Stop Calculation:
High Stop: The highest high over the stop length minus the ATR multiplied by the ATR multiplier.
Low Stop: The lowest low over the stop length plus the ATR multiplied by the ATR multiplier.
SMA Calculation: The 21-period SMA of the closing price is used as a trend filter.
Entry and Exit Conditions:
Long Entry: A long position is initiated when the closing price crosses over the low stop and is above the 21-period SMA. This condition ensures that the market is trending upward and that the entry is made in the direction of the prevailing trend.
Exit Long: The long position is exited when the closing price falls below the high stop, indicating potential downward movement and protecting against significant drawdowns.
Position Sizing:
The quantity of shares to trade is calculated based on the selected calculation mode (linear or exponential) and the risk multiplier. This ensures position size is adjusted dynamically based on current market conditions and user-defined risk tolerance.
Exponential Mode: Quantity is calculated using the formula: riskMultiplier / lowestClose * 1000 * strategy.equity / strategy.initial_capital.
Linear Mode: Quantity is calculated using the formula: riskMultiplier / lowestClose * 1000.
Execution:
When the long entry condition is met, the strategy triggers a buy signal, and a long position is entered with the calculated quantity. An alert is generated to notify the trader.
When the exit condition is met, the strategy closes the position and triggers a sell signal, accompanied by an alert.
Plotting:
Buy Signals: Indicated with an upward triangle below the bar.
Sell Signals: Indicated with a downward triangle above the bar.
Application
This strategy is particularly effective for trading the SPX on a 1-hour timeframe, capitalizing on price movements by adjusting stop levels dynamically based on market volatility and trend direction.
Default Setup
Initial Capital: $1,000
Risk Multiplier: 5
ATR Period: 10
ATR Multiplier: 3
Stop Length: 21
SMA Length: 21
Commission: 0.01
Slippage: 3 Ticks
Backtesting Results
Backtesting indicates that the "Chande Kroll Stop Strategy" performs optimally on the SPX when applied to the 1-hour timeframe. The strategy's dynamic adjustment of stop levels helps manage risk effectively while capturing significant upward price movements. Backtesting was conducted with a realistic initial capital of $1,000, and commissions and slippage were included to ensure the results are not misleading.
Risk Management
The strategy incorporates risk management through dynamically calculated stop levels based on the ATR and a user-defined risk multiplier. This approach ensures that position sizes are adjusted according to market volatility, helping to mitigate potential losses. Trades are sized to risk a sustainable amount of equity, adhering to the guideline of risking no more than 5-10% per trade.
Usage Notes
Customization: Users can adjust the ATR period, ATR multiplier, stop length, and SMA length to better suit their trading style and risk tolerance.
Alerts: The strategy includes alerts for buy and sell signals to keep traders informed of potential entry and exit points.
Pyramiding: Although possible, the strategy yields the best results without pyramiding.
Justification of Components
The Chande Kroll Stop indicator and the 21-period SMA are combined to provide a robust framework for identifying long trading opportunities in trending markets. Here is why they work well together:
Chande Kroll Stop Indicator: This indicator provides dynamic stop levels that adapt to market volatility, allowing traders to set logical stop-loss levels that account for current price movements. It is particularly useful in volatile markets where fixed stops can be easily hit by random price fluctuations. By using the ATR, the stop levels adjust based on recent market activity, ensuring they remain relevant in varying market conditions.
21-Period SMA: The 21-period SMA acts as a trend filter to ensure trades are taken in the direction of the prevailing market trend. By requiring the closing price to be above the SMA for long entries, the strategy aligns itself with the broader market trend, reducing the risk of entering trades against the overall market direction. This helps to avoid false signals and ensures that the trades are in line with the dominant market movement.
Combining these two components creates a balanced approach that captures trending price movements while protecting against significant drawdowns through adaptive stop levels. The Chande Kroll Stop ensures that the stops are placed at levels that reflect current volatility, while the SMA filter ensures that trades are only taken when the market is trending in the desired direction.
Concepts Underlying Calculations
ATR (Average True Range): Used to measure market volatility, which informs the stop levels.
SMA (Simple Moving Average): Used to filter trades, ensuring positions are taken in the direction of the trend.
Chande Kroll Stop: Combines high and low price levels with ATR to create dynamic stop levels that adapt to market conditions.
Risk Disclaimer
Trading involves substantial risk, and most day traders incur losses. The "Chande Kroll Stop Strategy" is provided for informational and educational purposes only. Past performance is not indicative of future results. Users are advised to adjust and personalize this trading strategy to better match their individual trading preferences and risk tolerance.

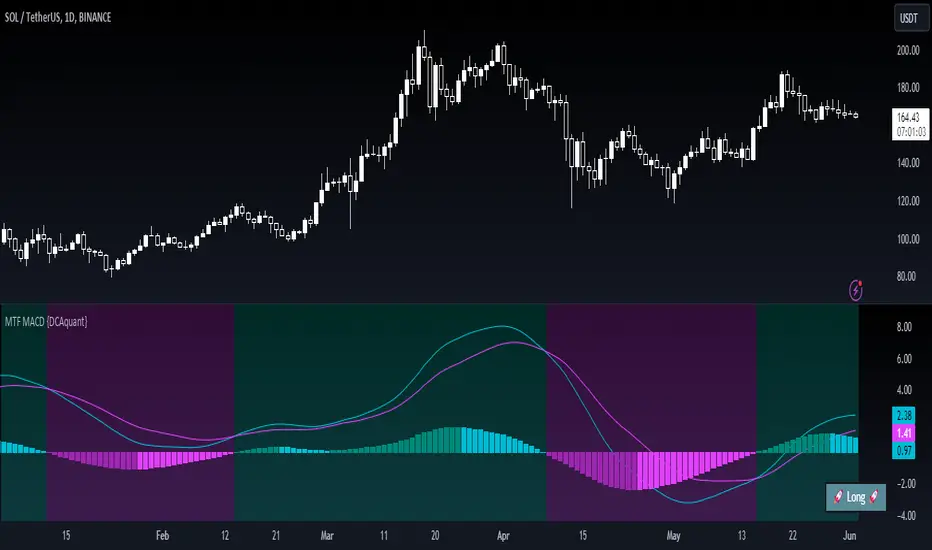
Multi Timeframe Moving Average Convergence Divergence {DCAquant}Overview
The MTF MACD indicator provides a unique view of MACD (Moving Average Convergence Divergence) and Signal Line dynamics across various timeframes. It calculates the MACD and Signal Line for each selected timeframe and aggregates them for analysis.
Key Features
MACD Calculation
Utilizes standard MACD calculations based on user-defined parameters like fast length, slow length, and signal smoothing.
Determines the difference between the MACD and Signal Line to identify convergence or divergence.
Multiple Timeframe Analysis
Allows users to select up to six different timeframes for analysis, ranging from minutes to days, providing a holistic view of market trends.
Calculates MACD and Signal Line for each timeframe independently.
Aggregated Analysis
Combines MACD and Signal Line values from multiple timeframes to derive a consolidated view.
Optionally applies moving average smoothing to aggregated MACD and Signal Line values for better clarity.
Position Identification
Determines the trading position (Long, Short, or Neutral) based on the relationship between MACD and Signal Line.
Considers the proximity of MACD and Signal Line to identify potential trading opportunities.
Visual Representation
Plots MACD and Signal Line on the price chart for visual analysis.
Utilizes color-coded backgrounds to indicate trading conditions (Long, Short, or Neutral) for quick interpretation.
Dynamic Table Display
Displays trading position alongside graphical indicators (rocket for Long, snowflake for Short, and star for Neutral) in a customizable table.
Offers flexibility in table placement and size for user preference.
How to Use
Parameter Configuration
Adjust parameters like fast length, slow length, and signal smoothing to fine-tune MACD calculations.
Select desired timeframes for analysis based on trading preferences and market conditions.
Interpretation
Monitor the relationship between MACD and Signal Line on the price chart.
Pay attention to color-coded backgrounds and graphical indicators in the table for actionable insights.
Decision Making
Consider entering Long positions when MACD is above the Signal Line and vice versa for Short positions.
Exercise caution during Neutral conditions, as there may be uncertainty in market direction.
Risk Management
Combine MTF MACD analysis with risk management strategies to optimize trade entries and exits.
Set stop-loss and take-profit levels based on individual risk tolerance and market conditions.
Conclusion
The Multi Timeframe Moving Average Convergence Divergence (MTF MACD) indicator offers a robust framework for traders to analyze market trends across multiple timeframes efficiently. By combining MACD insights from various time horizons and presenting them in a clear and actionable format, it empowers traders to make informed decisions and enhance their trading strategies.
Disclaimer
The Multi Timeframe Moving Average Convergence Divergence (MTF MACD) indicator provided here is intended for educational and informational purposes only. Trading in financial markets involves risk, and past performance is not indicative of future results. The use of this indicator does not guarantee profits or prevent losses.
Please be aware that trading decisions should be made based on your own analysis, risk tolerance, and financial situation. It is essential to conduct thorough research and seek advice from qualified financial professionals before engaging in any trading activity.
The MTF MACD indicator is a tool designed to assist traders in analyzing market trends and identifying potential trading opportunities. However, it is not a substitute for sound judgment and prudent risk management.
By using this indicator, you acknowledge that you are solely responsible for your trading decisions, and you agree to indemnify and hold harmless the developer and distributor of this indicator from any losses, damages, or liabilities arising from its use.
Trading in financial markets carries inherent risks, and you should only trade with capital that you can afford to lose. Exercise caution and discretion when implementing trading strategies, and consider seeking independent financial advice if necessary.
Trailing Management (Zeiierman)█ Overview
The Trailing Management (Zeiierman) indicator is designed for traders who seek an automated and dynamic approach to managing trailing stops. It helps traders make systematic decisions regarding when to enter and exit trades based on the calculated risk-reward ratio. By providing a clear visual representation of trailing stop levels and risk-reward metrics, the indicator is an essential tool for both novice and experienced traders aiming to enhance their trading discipline.
The Trailing Management (Zeiierman) indicator integrates a Break-Even Curve feature to enhance its utility in trailing stop management and risk-reward optimization. The Break-Even Curve illuminates the precise point at which a trade neither gains nor loses value, offering clarity on the risk-reward landscape. Furthermore, this precise point is calculated based on the required win rate and the risk/reward ratio. This calculation aids traders in understanding the type of strategy they need to employ at any given time to be profitable. In other words, traders can, at any given point, assess the kind of strategy they need to utilize to make money, depending on the price's position within the risk/reward box.
█ How It Works
The indicator operates by computing the highest high and the lowest low over a user-defined period and then applying this information to determine optimal trailing stop levels for both long and short positions.
Directional Bias:
It establishes the direction of the market trend by comparing the index of the highest high and the lowest low within the lookback period.
Bullish
Bearish
Trailing Stop Adjustment:
The trailing stops are adjusted using one of three methods: an automatic calculation based on the median of recent peak differences, pivot points, or a fixed percentage defined by the user.
The Break-Even Curve:
The Break-Even Curve, along with the risk/reward ratio, is determined through the trailing method. This approach utilizes the current closing price as a hypothetical entry point for trades. All calculations, including those for the curve, are based on this current closing price, ensuring real-time accuracy and relevance. As market conditions fluctuate, the curve dynamically adjusts, offering traders a visual benchmark that signifies the break-even point. This real-time adjustment provides traders with an invaluable tool, allowing them to visually track how shifts in the market could impact the point at which their trades neither gain nor lose value.
Example:
Let's say the price is at the midpoint of the risk/reward box; this means that the risk/reward ratio should be 1:1, and the minimum win rate is 50% to break even.
In this example, we can see that the price is near the stop-loss level. If you are about to take a trade in this area and would respect your stop, you only need to have a minimum win rate of 11% to earn money, given the risk/reward ratio, assuming that you hold the trade to the target.
In other words, traders can, at any given point, assess the kind of strategy they need to employ to make money based on the price's position within the risk/reward box.
█ How to Use
Market Bias:
When using the Auto Bias feature, the indicator calculates the underlying market bias and displays it as either bullish or bearish. This helps traders align their trades with the underlying market trend.
Risk Management:
By observing the plotted trailing stops and the risk-reward ratios, traders can make strategic decisions to enter or exit positions, effectively managing the risk.
Strategy selection:
The Break-Even Curve is a powerful tool for managing risk, allowing traders to visualize the relationship between their trailing stops and the market's price movements. By understanding where the break-even point lies, traders can adjust their strategies to either lock in profits or cut losses.
Based on the plotted risk/reward box and the location of the price within this box, traders can easily see the win rate required by their strategy to make money in the long run, given the risk/reward ratio.
Consider this example: The market is bullish, as indicated by the bias, and the indicator suggests looking into long trades. The price is near the top of the risk/reward box, which means entering the market right now carries a huge risk, and the potential reward is very low. To take this trade, traders must have a strategy with a win rate of at least 90%.
█ Settings
Trailing Method:
Auto: The indicator calculates the trailing stop dynamically based on market conditions.
Pivot: The trailing stop is adjusted to the highest high (long positions) or lowest low (short positions) identified within a specified lookback period. This method uses the pivotal points of the market to set the trailing stop.
Percentage: The trailing stop is set at a fixed percentage away from the peak high or low.
Trailing Size (prd):
This setting defines the lookback period for the highest high and lowest low, which affects the sensitivity of the trailing stop to price movements.
Percentage Step (perc):
If the 'Percentage' method is selected, this setting determines the fixed percentage for the trailing stop distance.
Set Bias (bias):
Allows users to set a market bias which can be Bullish, Bearish, or Auto, affecting how the trailing stop is adjusted in relation to the market trend.
-----------------
Disclaimer
The information contained in my Scripts/Indicators/Ideas/Algos/Systems does not constitute financial advice or a solicitation to buy or sell any securities of any type. I will not accept liability for any loss or damage, including without limitation any loss of profit, which may arise directly or indirectly from the use of or reliance on such information.
All investments involve risk, and the past performance of a security, industry, sector, market, financial product, trading strategy, backtest, or individual's trading does not guarantee future results or returns. Investors are fully responsible for any investment decisions they make. Such decisions should be based solely on an evaluation of their financial circumstances, investment objectives, risk tolerance, and liquidity needs.
My Scripts/Indicators/Ideas/Algos/Systems are only for educational purposes!

WaveTrendnel Oscillator [UAlgo]🔶Description:
The WaveTrendnel Oscillator, is a technical analysis tool designed for traders to identify potential trend reversals and overbought/oversold conditions in the market. It combines the concepts of wave analysis and trend analysis to generate signals based on the current market conditions. This indicator aims to provide traders with insights into the strength and direction of the prevailing trend, facilitating better decision-making in trading strategies.
🔶Key Features:
Customizable Parameters: Users can customize various parameters including the source data, channel length, average length, and signal length according to their trading preferences and market conditions.
Signal Display: The indicator offers the option to display buy and sell signals on the chart, helping traders to visually identify potential entry and exit points.
Wave and Kernel Analysis: The WaveTrendnel Oscillator utilizes a rational quadratic kernel function, which applies a mathematical approach known as the kernel method. This method analyzes historical price data by assigning weights to each data point based on its proximity to the current period, providing a smoother and more accurate representation of market trends.
Overbought/Oversold Levels: Traders can define overbought and oversold levels using customizable threshold parameters, enabling them to identify potential reversal points in the market.
🔶Credit:
The WaveTrendnel Oscillator indicator is a modification of the original WaveTrend Oscillator developed by @LazyBear on TradingView.
🔶Disclaimer:
Use with Caution: This indicator is provided for educational and informational purposes only and should not be considered as financial advice. Users should exercise caution and perform their own analysis before making trading decisions based on the indicator's signals.
Not Financial Advice: The information provided by this indicator does not constitute financial advice, and the creator (UAlgo) shall not be held responsible for any trading losses incurred as a result of using this indicator.
Backtesting Recommended: Traders are encouraged to backtest the indicator thoroughly on historical data before using it in live trading to assess its performance and suitability for their trading strategies.
Risk Management: Trading involves inherent risks, and users should implement proper risk management strategies, including but not limited to stop-loss orders and position sizing, to mitigate potential losses.
No Guarantees: The accuracy and reliability of the indicator's signals cannot be guaranteed, as they are based on historical price data and past performance may not be indicative of future results.

Liquidation Longs/Shorts [UAlgo]🔶Description:
The "Liquidation Longs/Shorts " indicator is designed to identify potential liquidation levels for long and short positions. It calculates the distance of the selected price source (close, high, low, or open) from two moving averages (MA) and plots the resulting values on the chart. When the price is at an extreme distance from the moving averages, it suggests a potential liquidation point for either long or short positions.
🔶Key Features:
Liquidation Calculations: The indicator calculates the distance of the selected price source from two moving averages: a simple moving average (SMA) and an exponential moving average (EMA) with customizable lengths.
Color Customization: Users can customize the colors of the plotted columns representing the distance from the moving averages for long and short liquidation levels.
Liquidation Circles: The indicator marks potential liquidation levels with small circles on the chart, with customizable colors for long and short liquidations.
Orange Circles -> Identifies Potential Short Liquidations
Aqua Circles -> Identifies Potential Long Liquidations
Example:
Adaptive Source Selection: Traders can select the price source (close, high, low, or open) for liquidation calculations, allowing flexibility based on their trading strategies.
Dynamic Threshold Calculation: The indicator dynamically adjusts the liquidation threshold based on the selected moving average lengths, providing adaptability to changing market conditions.
Disclaimer:
Use with Caution: This indicator is provided for educational purposes only and should not be considered as financial advice. Users should exercise caution and perform their own analysis before making trading decisions based on the indicator's signals.
Not Financial Advice: The information provided by this indicator does not constitute financial advice, and the creator (UAlgo) shall not be held responsible for any trading losses incurred as a result of using this indicator.
Backtesting Recommended: Traders are encouraged to backtest the indicator thoroughly on historical data before using it in live trading to assess its performance and suitability for their trading strategies.
Risk Management: Trading involves inherent risks, and users should implement proper risk management strategies, including but not limited to stop-loss orders and position sizing, to mitigate potential losses.
No Guarantees: The accuracy and reliability of the indicator's signals cannot be guaranteed, as they are based on historical price data and past performance may not be indicative of future results.
This indicator serves as a tool to assist traders in identifying potential liquidation levels, but it should be used in conjunction with other technical analysis tools and risk management practices for effective trading decision-making.

London BreakOut ClassicHey there, this is my first time publishing a strategy. The strategy is based on the London Breakout Idea, an incredibly popular concept with abundant information available online.
Let me summarize the London Breakout Strategy in a nutshell: It involves identifying key price levels based on the Tokyo Session before the London Session starts. Typically, these key levels are the high and low of the previous Tokyo session. If a breakout occurs during the London session, you simply follow the trend.
The purpose of this code
After conducting my research, I came across numerous posts, videos, and articles discussing the London Breakout Strategy. I aimed to automatically test it myself to verify whether the claims made by these so-called trading gurus are accurate or not. Consequently, I wrote this script to gain an understanding of how this strategy would perform if I were to follow its basic settings blindly.
Explanation of drawings on the chart:
Red or Green Box: A box is drawn on our chart displaying the exact range of the Tokyo trading session. This box is colored red if the trend during the session was downward and green if it was upward. The box is always drawn between the high and the low between 0:00 AM and 7:00 AM UTC. You can change the settings via the Inputs "Session time Tokyo" & "Session time zone".
Green Background: The green background represents the London trading session. My code allows us to make entries only during this time. If we haven't entered a trade, any pending orders are canceled. I've also programmed a timeout at 11 pm to ensure every trade is closed before the new Tokyo session begins.
Red Line: The red line is automatically placed in the middle of our previous Tokyo range. This line acts as our stop loss. If we cross this line after entering a trade but before reaching our take profit, we'll be stopped out.
When do we enter a trade?
We wait for a candle body to close outside of the previous Tokyo range to enter a trade with the opening of the next candle. We only enter one trade per day.
Where do we put our Take Profit?
The code calculates the exact distance between our entry point and the stop loss. We are trading a risk-reward ratio of 1:1 by default, meaning our take profit is always the same number of pips away from our entry as the stop loss. The Stop Loss is always defined by the red line on the chart. You can change the risk-reward ratio via the inputs setting "CRV", to see how the result changes.
What is the purpose of this script?
I wanted to backtest the London breakout strategy to see how it actually works. Therefore, I wrote this code so that everybody can test it for themselves. You can change the settings and see how the result changes. Typically, you should test this strategy on forex markets and on either 1Min, 5 Min, or 15 Min timeframe.
What are the results?
Over the last 3-6 months (over 100 trades), trading the strategy with my default settings hasn't proven to be very successful. Consequently, I do not recommend trading this strategy blindly. The purpose of this code is to provide you with a foundation for the London Breakout Strategy, allowing you to modify and enhance it according to your preferences. If you're contemplating whether to give it a try, you can assess the results from the past months by using this code as a starting point.

Portfolio HeatThe "Portfolio Heat" indicator offers a visual representation of potential risk exposure for a portfolio across up to eight different symbols. It dynamically calculates three risk metrics based on current price, the number of shares owned, your designated stop loss, and total account size.
Open Dollar Risk – the total dollar amount you will lose if your stop loss is hit.
Open % of Portfolio Risk – the risk as a percentage of your total account size.
Starting Capital Risk – the dollar amount risked based on the difference between the entry price and stop price.
These metrics adjust in real-time, allowing you to monitor and manage risk more effectively.
Open portfolio heat refers to how much you would lose if all your currently held stock positions hit their stop-losses, whether those stop-losses are below what you paid for them - referred to as your “cost basis” - at your cost basis (breakeven) or above your cost basis (in the money). Admittedly, it’s a pretty bad day when all your stops are hit at once, but as traders we need to prepare for the worst. To visualize what “open heat” looks like on a single stock position, please note the chart below:
In the example above you can see that if you were to purchase 100 shares of this stock at a cost-basis of $18/share, and your stop-loss is placed at $15, if the current price of the stock is at $20 and the stock price drops to hit your stop-loss, it would result in a $500 total drawdown in your portfolio. Keep in mind this is just one stock position. Hypothetically, if you were even holding two stocks that had the above open heat, with a $10,000 account size, you could experience a 10% drawdown quite fast if the market corrects.
The “Portfolio Heat” indicator is fully customizable allowing traders to select the number of positions in the portfolio, colors and a detailed or a summary view of risk.
Note if entering a short position, you will enter the number of shares owned as a negative number.

Risk Reward Optimiser [ChartPrime]█ CONCEPTS
In modern day strategy optimization there are few options when it comes to optimizing a risk reward ratio. Users frequently need to experiment and go through countless permutations in order to tweak, adjust and find optimal in their data.
Therefore we have created the Risk Reward Optimizer.
The Risk Reward Optimizer is a technical tool designed to provide traders with comprehensive insights into their trading strategies.
It offers a range of features and functionalities aimed at enhancing traders' decision-making process.
With a focus on comprehensive data, it is there to help traders quickly and efficiently locate Risk Reward optimums for inbuilt of custom strategies.
█ Internal and external Signals:
The script can optimize risk to reward ratio for any type of signals
You can utilize the following :
🔸Internal signals ➞ We have included a number of common indicators into the optimizer such as:
▫️ Aroon
▫️ AO (Awesome Oscillator)
▫️ RSI (Relative Strength Index)
▫️ MACD (Moving Average Convergence Divergence)
▫️ SuperTrend
▫️ Stochastic RSI
▫️ Stochastic
▫️ Moving averages
All these indicators have 3 conditions to generate signals :
Crossover
High Than
Less Than
🔸External signal
▫️ by incorporating your own indicators into the analysis. This flexibility enables you to tailor your strategy to your preferences.
◽️ How to link your signal with the optimizer:
In order to be able to analysis your signal we need to read it and to do so we would need to PLOT your signal with a defined value
plot( YOUR LONG Condition ? 100 : 0 , display = display.data_window)
█ Customizable Risk to Reward Ratios:
This tool allows you to test seven different customizable risk to reward ratios , helping you determine the most suitable risk-reward balance for your trading strategy. This data-driven approach takes the guesswork out of setting stop-loss and take-profit levels.
█ Comprehensive Data Analysis:
The tool provides a table displaying key metrics, including:
Total trades
Wins
Losses
Profit factor
Win rate
Profit and loss (PNL)
This data is essential for refining your trading strategy.
🔸 It includes a tooltip for each risk to reward ratio which gives data for the:
Most Profitable Trade USD value
Most Profitable Trade % value
Most Profitable Trade Bar Index
Most Profitable Trade Time (When it occurred)
Position and size is adjustable
█ Visual insights with histograms:
Visualize your trading performance with histograms displaying each risk to reward ratio trade space, showing total trades, wins, losses, and the ratio of profitable trades.
This visual representation helps you understand the strengths and weaknesses of your strategy.
It offers tooltips for each RR ratio with the average win and loss percentages for further analysis.
█ Dynamic Highlighting:
A drop-down menu allows you to highlight the maximum values of critical metrics such as:
Profit factor
Win rate
PNL
for quick identification of successful setups.
█ Stop Loss Flexibility:
You can adjust stop-loss levels using three different calculation methods:
ATR
Pivot
VWAP
This allows you to align risk-reward ratios with your preferred risk tolerance.
█ Chart Integration:
Visualize your trades directly on your price chart, with each trade displayed in a distinct color for easy tracking.
When your take-profit (TP) level is reached , the tool labels the corresponding risk-reward ratio for that specific TP, simplifying trade management.
█ Detailed Tooltips:
Tooltips provide deeper insights into your trading performance. They include information about the most profitable trade, such as the time it occurred, the bar index, and the percentage gain. Histogram tooltips also offer average win and loss percentages for further analysis.
█ Settings:
█ Code:
In summary, the Risk Reward Optimizer is a data-driven tool that offers traders the ability to optimize their risk-reward ratios, refine their strategies, and gain a deeper understanding of their trading performance. Whether you're a day trader, swing trader, or investor, this tool can help you make informed decisions and improve your trading outcomes.

CCI+EMA Strategy with Percentage or ATR TP/SL [Alifer]This is a momentum strategy based on the Commodity Channel Index (CCI), with the aim of entering long trades in oversold conditions and short trades in overbought conditions.
Optionally, you can enable an Exponential Moving Average (EMA) to only allow trading in the direction of the larger trend. Please note that the strategy will not plot the EMA. If you want, for visual confirmation, you can add to the chart an Exponential Moving Average as a second indicator, with the same settings used in the strategy’s built-in EMA.
The strategy also allows you to set internal Stop Loss and Take Profit levels, with the option to choose between Percentage-based TP/SL or ATR-based TP/SL.
The strategy can be adapted to multiple assets and timeframes:
Pick an asset and a timeframe
Zoom back as far as possible to identify meaningful positive and negative peaks of the CCI
Set Overbought and Oversold at a rough average of the peaks you identified
Adjust TP/SL according to your risk management strategy
Like the strategy? Give it a boost!
Have any questions? Leave a comment or drop me a message.
CAUTIONARY WARNING
Please note that this is a complex trading strategy that involves several inputs and conditions. Before using it in live trading, it is highly recommended to thoroughly test it on historical data and use risk management techniques to safeguard your capital. After backtesting, it's also highly recommended to perform a first live test with a small amount. Additionally, it's essential to have a good understanding of the strategy's behavior and potential risks. Only risk what you can afford to lose .
USED INDICATORS
1 — COMMODITY CHANNEL INDEX (CCI)
The Commodity Channel Index (CCI) is a technical analysis indicator used to measure the momentum of an asset. It was developed by Donald Lambert and first published in Commodities magazine (now Futures) in 1980. Despite its name, the CCI can be used in any market and is not just for commodities. The CCI compares current price to average price over a specific time period. The indicator fluctuates above or below zero, moving into positive or negative territory. While most values, approximately 75%, fall between -100 and +100, about 25% of the values fall outside this range, indicating a lot of weakness or strength in the price movement.
The CCI was originally developed to spot long-term trend changes but has been adapted by traders for use on all markets or timeframes. Trading with multiple timeframes provides more buy or sell signals for active traders. Traders often use the CCI on the longer-term chart to establish the dominant trend and on the shorter-term chart to isolate pullbacks and generate trade signals.
CCI is calculated with the following formula:
(Typical Price - Simple Moving Average) / (0.015 x Mean Deviation)
Some trading strategies based on CCI can produce multiple false signals or losing trades when conditions turn choppy. Implementing a stop-loss strategy can help cap risk, and testing the CCI strategy for profitability on your market and timeframe is a worthy first step before initiating trades.
2 — AVERAGE TRUE RANGE (ATR)
The Average True Range (ATR) is a technical analysis indicator that measures market volatility by calculating the average range of price movements in a financial asset over a specific period of time. The ATR was developed by J. Welles Wilder Jr. and introduced in his book “New Concepts in Technical Trading Systems” in 1978.
The ATR is calculated by taking the average of the true range over a specified period. The true range is the greatest of the following:
The difference between the current high and the current low.
The difference between the previous close and the current high.
The difference between the previous close and the current low.
The ATR can be used to set stop-loss orders. One way to use ATR for stop-loss orders is to multiply the ATR by a factor (such as 2 or 3) and subtract it from the entry price for long positions or add it to the entry price for short positions. This can help traders set stop-loss orders that are more adaptive to market volatility.
3 — EXPONENTIAL MOVING AVERAGE (EMA)
The Exponential Moving Average (EMA) is a type of moving average (MA) that places a greater weight and significance on the most recent data points.
The EMA is calculated by taking the average of the true range over a specified period. The true range is the greatest of the following:
The difference between the current high and the current low.
The difference between the previous close and the current high.
The difference between the previous close and the current low.
The EMA can be used by traders to produce buy and sell signals based on crossovers and divergences from the historical average. Traders often use several different EMA lengths, such as 10-day, 50-day, and 200-day moving averages.
The formula for calculating EMA is as follows:
Compute the Simple Moving Average (SMA).
Calculate the multiplier for weighting the EMA.
Calculate the current EMA using the following formula:
EMA = Closing price x multiplier + EMA (previous day) x (1-multiplier)
STRATEGY EXPLANATION
1 — INPUTS AND PARAMETERS
The strategy uses the Commodity Channel Index (CCI) with additional options for an Exponential Moving Average (EMA), Take Profit (TP) and Stop Loss (SL).
length : The period length for the CCI calculation.
overbought : The overbought level for the CCI. When CCI crosses above this level, it may signal a potential short entry.
oversold : The oversold level for the CCI. When CCI crosses below this level, it may signal a potential long entry.
useEMA : A boolean input to enable or disable the use of Exponential Moving Average (EMA) as a filter for long and short entries.
emaLength : The period length for the EMA if it is used.
2 — CCI CALCULATION
The CCI indicator is calculated using the following formula:
(src - ma) / (0.015 * ta.dev(src, length))
src is the typical price (average of high, low, and close) and ma is the Simple Moving Average (SMA) of src over the specified length.
3 — EMA CALCULATION
If the useEMA option is enabled, an EMA is calculated with the given emaLength .
4 — TAKE PROFIT AND STOP LOSS METHODS
The strategy offers two methods for TP and SL calculations: percentage-based and ATR-based.
tpSlMethod_percentage : A boolean input to choose the percentage-based method.
tpSlMethod_atr : A boolean input to choose the ATR-based method.
5 — PERCENTAGE-BASED TP AND SL
If tpSlMethod_percentage is chosen, the strategy calculates the TP and SL levels based on a percentage of the average entry price.
tp_percentage : The percentage value for Take Profit.
sl_percentage : The percentage value for Stop Loss.
6 — ATR-BASED TP AND SL
If tpSlMethod_atr is chosen, the strategy calculates the TP and SL levels based on Average True Range (ATR).
atrLength : The period length for the ATR calculation.
atrMultiplier : A multiplier applied to the ATR to set the SL level.
riskRewardRatio : The risk-reward ratio used to calculate the TP level.
7 — ENTRY CONDITIONS
The strategy defines two conditions for entering long and short positions based on CCI and, optionally, EMA.
Long Entry: CCI crosses below the oversold level, and if useEMA is enabled, the closing price should be above the EMA.
Short Entry: CCI crosses above the overbought level, and if useEMA is enabled, the closing price should be below the EMA.
8 — TP AND SL LEVELS
The strategy calculates the TP and SL levels based on the chosen method and updates them dynamically.
For the percentage-based method, the TP and SL levels are calculated as a percentage of the average entry price.
For the ATR-based method, the TP and SL levels are calculated using the ATR value and the specified multipliers.
9 — EXIT CONDITIONS
The strategy defines exit conditions for both long and short positions.
If there is a long position, it will be closed either at TP or SL levels based on the chosen method.
If there is a short position, it will be closed either at TP or SL levels based on the chosen method.
Additionally, positions will be closed if CCI crosses back above oversold in long positions or below overbought in short positions.
10 — PLOTTING
The script plots the CCI line along with overbought and oversold levels as horizontal lines.
The CCI line is colored red when above the overbought level, green when below the oversold level, and white otherwise.
The shaded region between the overbought and oversold levels is plotted as well.

Volume ValueWhen VelocityTitle: Volume ValueWhen Velocity Trading Strategy
▶ Introduction:
The " Volume ValueWhen Velocity " trading strategy is designed to generate long position signals based on various technical conditions, including volume thresholds, RSI (Relative Strength Index), and price action relative to the Simple Moving Average (SMA). The strategy aims to identify potential buy opportunities when specific criteria are met, helping traders capitalize on potential bullish movements.
▶ How to use and conditions
★ Important : Only on Spot Binance BINANCE:BTCUSDT
Name: Volume ValueWhen Velocity
Operating mode: Long on Spot BINANCE BINANCE:BTCUSDT
Timeframe: Only one hour
Market: Crypto
currency: Bitcoin only
Signal type: Medium or short term
Entry: All sections in the Technical Indicators and Conditions section must be saved to enter (This is explained below)
Exit: Based on loss limit and profit limit It is removed in the settings section
Backtesting:
⁃ Exchange: BINANCE BINANCE:BTCUSDT
⁃ Pair: BTCUSDT
⁃ Timeframe:1h
⁃ Fee: 0.1%
- Initial Capital: 1,000 USDT
- Position sizing: 500 usdt
-Trading Range: 2022-07-01 11:30 ___ 2023-07-21 14:30
▶ Strategy Settings and Parameters:
1. `strategy(title='Volume ValueWhen Velocity', ...`: Sets the strategy title, initial capital, default quantity type, default quantity value, commission value, and trading currency.
↬ Stop-Loss and Take-Profit Settings:
1. long_stoploss_value and long_stoploss_percentage : Define the stop-loss percentage for long positions.
2. long_takeprofit_value and long_takeprofit_percentage : Define the take-profit percentage for long positions.
↬ ValueWhen Occurrence Parameters:
1. occurrence_ValueWhen_1 and occurrence_ValueWhen_2 : Control the occurrences of value events.
2. `distance_value`: Specifies the minimum distance between occurrences of ValueWhen 1 and ValueWhen 2.
↬ RSI Settings:
1. rsi_over_sold and rsi_length : Define the oversold level and RSI length for RSI calculations.
↬ Volume Thresholds:
1. volume_threshold1 , volume_threshold2 , and volume_threshold3 : Set the volume thresholds for multiple volume conditions.
↬ ATR (Average True Range) Settings:
1. atr_small and atr_big : Specify the periods used to calculate the Average True Range.
▶ Date Range for Back-Testing:
1. start_date, end_date, start_month, end_month, start_year, and end_year : Define the date range for back-testing the strategy.
▶ Technical Indicators and Conditions:
1. rsi: Calculates the Relative Strength Index (RSI) based on the defined RSI length and the closing prices.
2. was_over_sold: Checks if the RSI was oversold in the last 10 bars.
3. getVolume and getVolume2 : Custom functions to retrieve volume data for specific bars.
4. firstCandleColor : Evaluates the color of the first candle based on different timeframes.
5. sma : Calculates the Simple Moving Average (SMA) of the closing price over 13 periods.
6. numCandles : Counts the number of candles since the close price crossed above the SMA.
7. atr1 : Checks if the ATR_small is less than ATR_big for the specified security and timeframe.
8. prevClose, prevCloseBarsAgo, and prevCloseChange : ValueWhen functions to calculate the change in the close price between specific occurrences.
9. atrval: A condition based on the ATR_value3.
▶ Buy Signal Condition:
Condition: A combination of multiple volume conditions.
buy_signal: The final buy signal condition that considers various technical conditions and their interactions.
▶ Long Strategy Execution:
1. The strategy will enter a long position (buy) when the buy_signal condition is met and within the specified date range.
2. A stop-loss and take-profit will be set for the long position to manage risk and potential profits.
▶ Conclusion:
The " Volume ValueWhen Velocity " trading strategy is designed to identify long position opportunities based on a combination of volume conditions, RSI, and price action. The strategy aims to capitalize on potential bullish movements and utilizes a stop-loss and take-profit mechanism to manage risk and optimize potential returns. Traders can use this strategy as a starting point for their own trading systems or further customize it to suit their preferences and risk appetite. It is crucial to thoroughly back-test and validate any trading strategy before deploying it in live markets.
↯ Disclaimer:
Risk Management is crucial, so adjust stop loss to your comfort level. A tight stop loss can help minimise potential losses. Use at your own risk.
How you or we can improve? Source code is open so share your ideas!
Leave a comment and smash the boost button!

Yesterday's High v.17.07Yesterday’s High Breakout it is a trading system based on the analysis of yesterday's highs, it works in trend-following mode therefore it opens a long position at the breakout of yesterday's highs even if they occur several times in one day.
There are several methods for exiting a trade, each with its own unique strategy. The first method involves setting Take-Profit and Stop-Loss percentages, while the second utilizes a trailing-stop with a specified offset value. The third method calls for a conditional exit when the candle closes below a reference EMA.
Additionally, operational filters can be applied based on the volatility of the currency pair, such as calculating the percentage change from the opening or incorporating a gap to the previous day's high levels. These filters help to anticipate or delay entry into the market, mitigating the risk of false breakouts.
In the specific case of INJ, a 12% Take-Profit and a 1.5% Stop-Loss were set, with an activated trailing-stop percentage, TRL 1 and OFF 0.5.
To postpone entry and avoid false breakouts, a 1% gap was added to the price of yesterday's highs.
Name: Yesterday's High Breakout - Trend Follower Strategy
Author: @tumiza999
Category: Trend Follower, Breakout of Yesterday's High.
Operating mode: Spot or Futures (only long).
Trade duration: Intraday.
Timeframe: 30M, 1H, 2H, 4H
Market: Crypto
Suggested usage: Short-term trading, when the market is in trend and it is showing high volatility.
Entry: When there is a breakout of Yesterday's High.
Exit: Profit target or Trailing stop, Stop loss or Crossunder EMA.
Configuration:
- Gap to anticipate or postpone the entry before or after the identified level
- Rate of Change for Entry Condition
- Take Profit, Stop Loss and Trailing Stop
- EMA length
Backtesting:
⁃ Exchange: BINANCE
⁃ Pair: INJUSDT
⁃ Timeframe: 4H
- Treshold: 1
- Gap%: 1
- SL: 1.5
- TP:12
- TRL: 1
- OFF-TRL: 0.5
⁃ Fee: 0.075%
⁃ Slippage: 1
- Initial Capital: 10000 USDT
- Position sizing: 10% of Equity
- Start : 2018-07-26 (Out Of Sample from 2022-12-23)
- Bar magnifier: on
Credits: LucF for Pine Coders (f_security function to avoid repainting using security)
Disclaimer: Risk Management is crucial, so adjust stop loss to your comfort level. A tight stop loss can help minimise potential losses. Use at your own risk.
How you or we can improve? Source code is open so share your ideas!
Leave a comment and smash the boost button!
Thanks for your attention, happy to support the TradingView community.

VolatilityThis script shows three different calculations for volatility.
All three can be used as Stop-Loss...
- Absolute Price Changes
- Maximum Price Fluctuation
- and every one should know Average True Range
The script has a dark and light theme.
And the colors can be changed and each can be deactivated.
On top of that I stumbled over the fact that when MPF crosses over APC
this could result in a significant change in price and could also be used as an entry or exit.
This is also highlighted by default. You can change its background color and you can deactivate it too.
ACP measures volatility over most recent close prices.
This is excellent for comparing volatility.
It includes both frequency and magnitude.
In other words: Sum of differences between second to last close price and last close price as absolute value for 'n' bars.
MPF measures volatility over most recent candles, which could be used as an estimate of risk.
It may also be effective as the basis for a stop-loss or take-profit,
like the ATR but it ignores the frequency of directional changes within the time interval.
In other words: The difference between the highest high and lowest low over 'n' bars.
When you don't know what the ATR is then you can look at this link .

Pure Morning 2.0 - Candlestick Pattern Doji StrategyThe new "Pure Morning 2.0 - Candlestick Pattern Doji Strategy" is a trend-following, intraday cryptocurrency trading system authored by devil_machine.
The system identifies Doji and Morning Doji Star candlestick formations above the EMA60 as entry points for long trades.
For best results we recommend to use on 15-minute, 30-minute, or 1-hour timeframes, and are ideal for high-volatility markets.
The strategy also utilizes a profit target or trailing stop for exits, with stop loss set at the lowest low of the last 100 candles. The strategy's configuration details, such as Doji tolerance, and exit configurations are adjustable.
In this new version 2.0, we've incorporated a new selectable filter. Since the stop loss is set at the lowest low, this filter ensures that this value isn't too far from the entry price, thereby optimizing the Risk-Reward ratio.
In the specific case of ALPINE, a 9% Take-Profit and and Stop-Loss at Lowest Low of the last 100 candles were set, with an activated trailing-stop percentage, Max Loss Filter is not active.
Name : Pure Morning 2.0 - Candlestick Pattern Doji Strategy
Author : @devil_machine
Category : Trend Follower based on candlestick patterns.
Operating mode : Spot or Futures (only long).
Trades duration : Intraday
Timeframe : 15m, 30m, 1H
Market : Crypto
Suggested usage : Short-term trading, when the market is in trend and it is showing high volatility .
Entry : When a Doji or Morning Doji Star formation occurs above the EMA60.
Exit : Profit target or Trailing stop, Stop loss on the lowest low of the last 100 candles.
Configuration :
- Doji Settings (tolerances) for Entry Condition
- Max Loss Filter (Lowest Low filter)
- Exit Long configuration
- Trailing stop
Backtesting :
⁃ Exchange: BINANCE
⁃ Pair: ALPINEUSDT
⁃ Timeframe: 30m
⁃ Fee: 0.075%
⁃ Slippage: 1
- Initial Capital: 10000 USDT
- Position sizing: 10% of Equity
- Start: 2022-02-28 (Out Of Sample from 2022-12-23)
- Bar magnifier: on
Disclaimer : Risk Management is crucial, so adjust stop loss to your comfort level. A tight stop loss can help minimise potential losses. Use at your own risk.
How you or we can improve? Source code is open so share your ideas!
Leave a comment and smash the boost button!
Thanks for your attention, happy to support the TradingView community.

[MAD] Position starter & calculatorThe tool you're using is a financial instrument trading planner and analyzer.
Here is how to use it:
Trade Planning: You can plan your trade entries and exits, calculating potential profits, losses, and their ratio (P/L ratio).
You can define up to five target closing prices with varying volumes, which can be individually activated or deactivated (volume set to 0%).
Risk Management: There's a stop-loss function to calculate and limit potential losses.
Additionally, it includes a liquidation pre-calculation for adjustable leverages and position maintenance(subject to exchange variation).
Customization: You can customize the tool's appearance with five adjustable color schemes, light and dark.
-----------------
Initiation: This tool functions as an indicator.
To start, add it as an indicator.
Once added, you can close the indicator window.
Now wait, till you'll see a blue box at the bottom of the input window.
Parameter Input:
Enter your parameters (SL, box left, box right, TP1, TP2, TP3, TP4, TP5) in the direction of the desired trade.
Click from top to bottom for a short trade or bottom to top for a long trade.
Adjustment: If you want to move the box in the future, adjust the times in the indicator settings directly as click input is not yet platform-supported.
This tool functions as a ruler and doesn't offer alerts (for now).
Here is another examples of how to set up a Position-calculation but here for a short:
Have fun trading
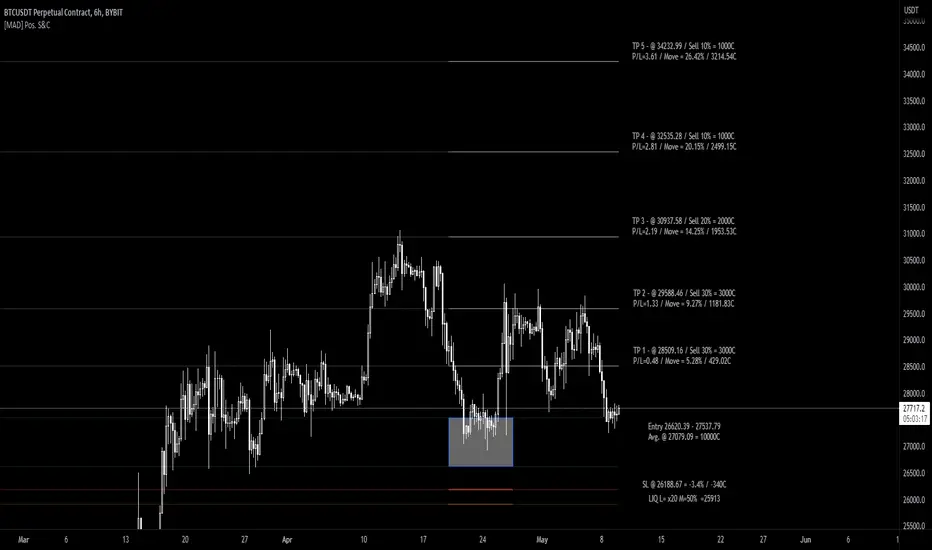
Chandelier Exit ZLSMA StrategyIntroducing a Powerful Trading Indicator: Chandelier Exit with ZLSMA
If you're a trader, you know the importance of having the right tools and indicators to make informed decisions. That's why we're excited to introduce a powerful new trading indicator that combines the Chandelier Exit and ZLSMA: two widely-used and effective indicators for technical analysis.
The Chandelier Exit (CE) is a popular trailing stop-loss indicator developed by Chuck LeBeau. It's designed to follow the price trend of a security and provide an exit signal when the price crosses below the CE line. The CE line is based on the Average True Range (ATR), which is a measure of volatility. This means that the CE line adjusts to the volatility of the security, making it a reliable indicator for trailing stop-losses.
The ZLEMA (Zero Lag Exponential Moving Average) is a type of exponential moving average that's designed to reduce lag and improve signal accuracy. The ZLSMA takes into account not only the current price but also past prices, using a weighted formula to calculate the moving average. This makes it a smoother indicator than traditional moving averages, and less prone to giving false signals.
When combined, the CE and ZLSMA create a powerful indicator that can help traders identify trend changes and make more informed trading decisions. The CE provides the trailing stop-loss signal, while the ZLSMA provides a smoother trend line to help identify potential entry and exit points.
In our indicator, the CE and ZLSMA are plotted together on the chart, making it easy to see both the trailing stop-loss and the trend line at the same time. The CE line is displayed as a dotted line, while the ZLSMA line is displayed as a solid line.
Using this indicator, traders can set their stop-loss levels based on the CE line, while also using the ZLSMA line to identify potential entry and exit points. The combination of these two indicators can help traders reduce their risk and improve their trading performance.
In conclusion, the Chandelier Exit with ZLSMA is a powerful trading indicator that combines two effective technical analysis tools. By using this indicator, traders can identify trend changes, set stop-loss levels, and make more informed trading decisions. Try it out for yourself and see how it can improve your trading performance.
Warning: The results in the backtest are from a repainting strategy. Don't take them seriously. You need to do a dry live test in order to test it for its useability.
-
Here is a description of each input field in the provided source code:
length: An integer input used as the period for the ATR (Average True Range) calculation. Default value is 1.
mult: A float input used as a multiplier for the ATR value. Default value is 2.
showLabels: A boolean input that determines whether to display buy/sell labels on the chart. Default value is false.
isSignalLabelEnabled: A boolean input that determines whether to display signal labels on the chart. Default value is true.
useClose: A boolean input that determines whether to use the close price for extrema calculations. Default value is true.
zcolorchange: A boolean input that determines whether to enable rising/decreasing highlighting for the ZLSMA (Zero-Lag Exponential Moving Average) line. Default value is false.
zlsmaLength: An integer input used as the length for the ZLSMA calculation. Default value is 50.
offset: An integer input used as an offset for the ZLSMA calculation. Default value is 0.
-
Ty for checking this out and good luck on your trading journey! Likes and comments are appreciated. 👍
--
Credits to:
▪ @everget – Chandelier Exit (CE)
▪ @netweaver2022 – ZLSMA
